Capturing Pattern Relationships in Multivariate Time Series through an Episode-Cluster GCN
Minjeong Oh*, Jaesoo Yoo**, Dojin Choi* | *Changwon National University, **Chungbuk National University, Korea
omiin.jeong@gmail.com, yjs@chungbuk.ac.kr, dojinchoi@changwon.ac.kr
1
Introduction
Research Objective
Improving multivariate time-series forecasting accuracy
Existing Approaches
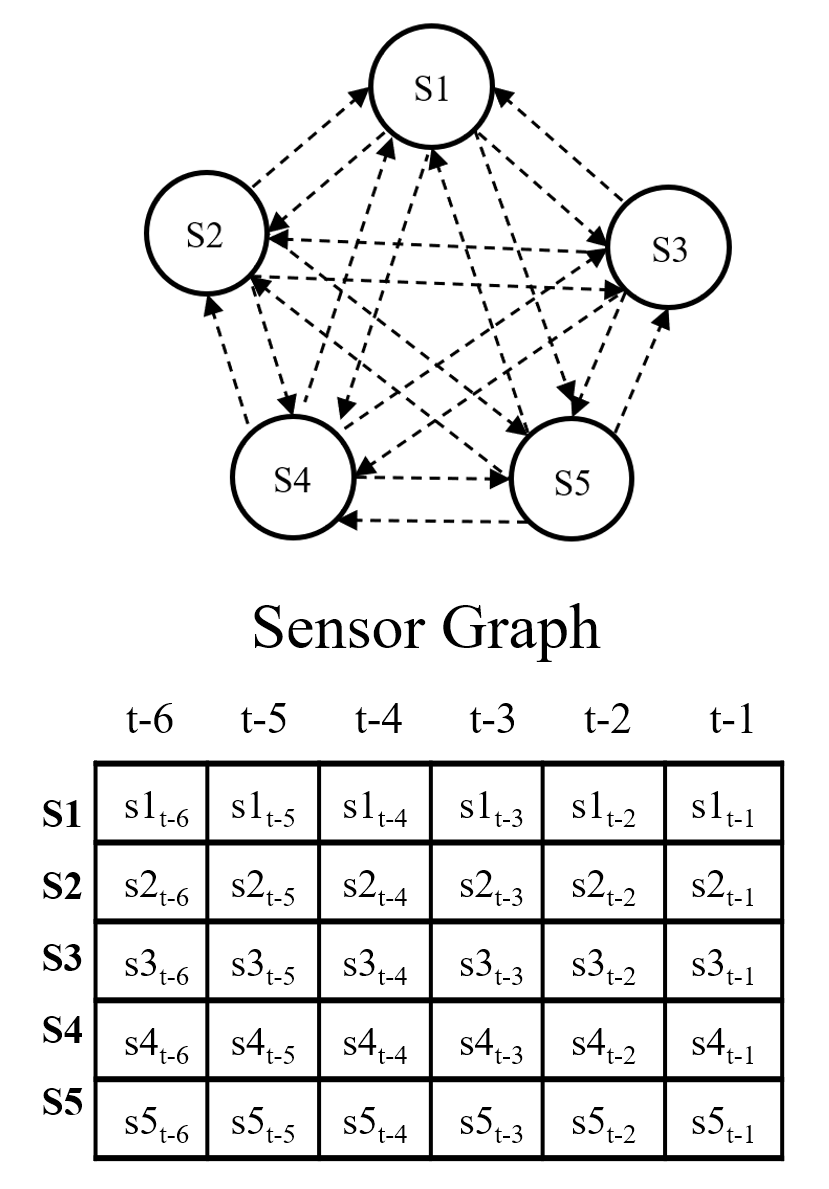
- GCN-based models rely mainly on inter-channel correlations
- They treat sensors (channels) as fixed graph nodes
- Uniform segmentation fails to capture meaningful pattern boundaries
Proposed Approach
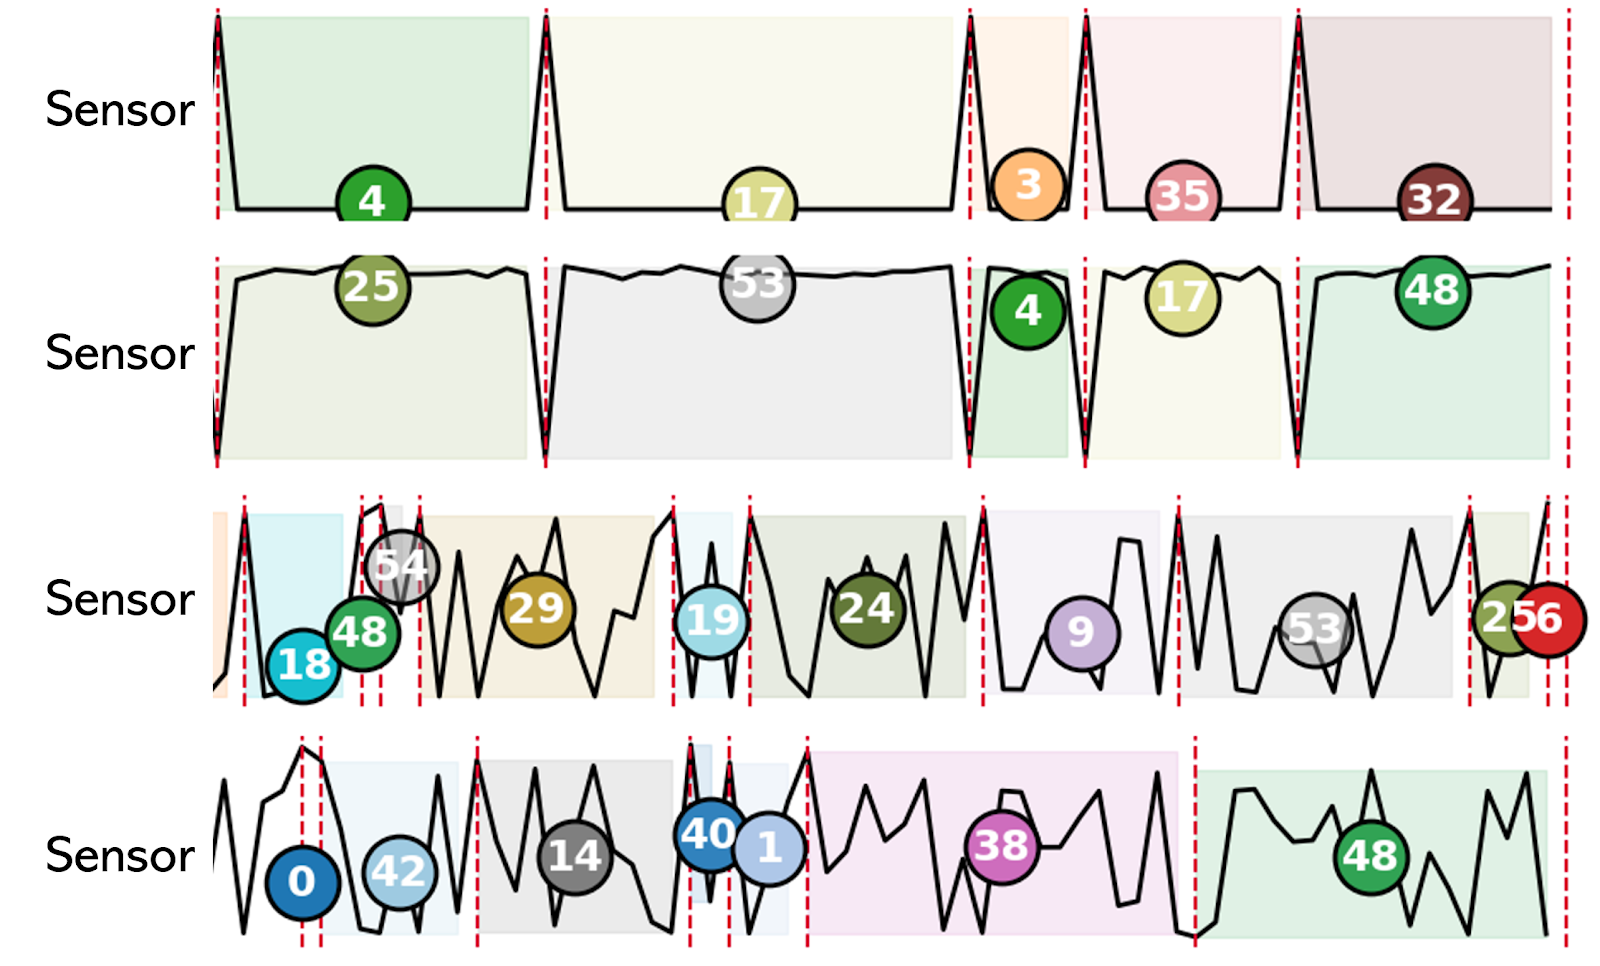
- Detect meaningful change points using surprisal-based episode segmentation
- Improve forecasting accuracy by capturing intra-channel pattern structures
2
Background
- Introduce the concept of surprisal-based segmentation for detecting meaningful pattern changes
- In EM-LLM, surprisal is computed using the model's prediction errors to identify unexpected changes
- We redefine this surprisal measure using a Gaussian Negative Log-Likelihood (NLL) for time-series data
- Surprisal quantification: Negative Log-Likelihood
-log P(xt | x1,...,xt-1; θ) > T with T = μt-τ:t + γσt-τ:t

3
Methodology
1
Use Informer to predict mean and standard deviation
2
Compute surprisal using Gaussian NLL based on the predicted mean and standard deviation
3
Detect boundaries via surprisal thresholding
4
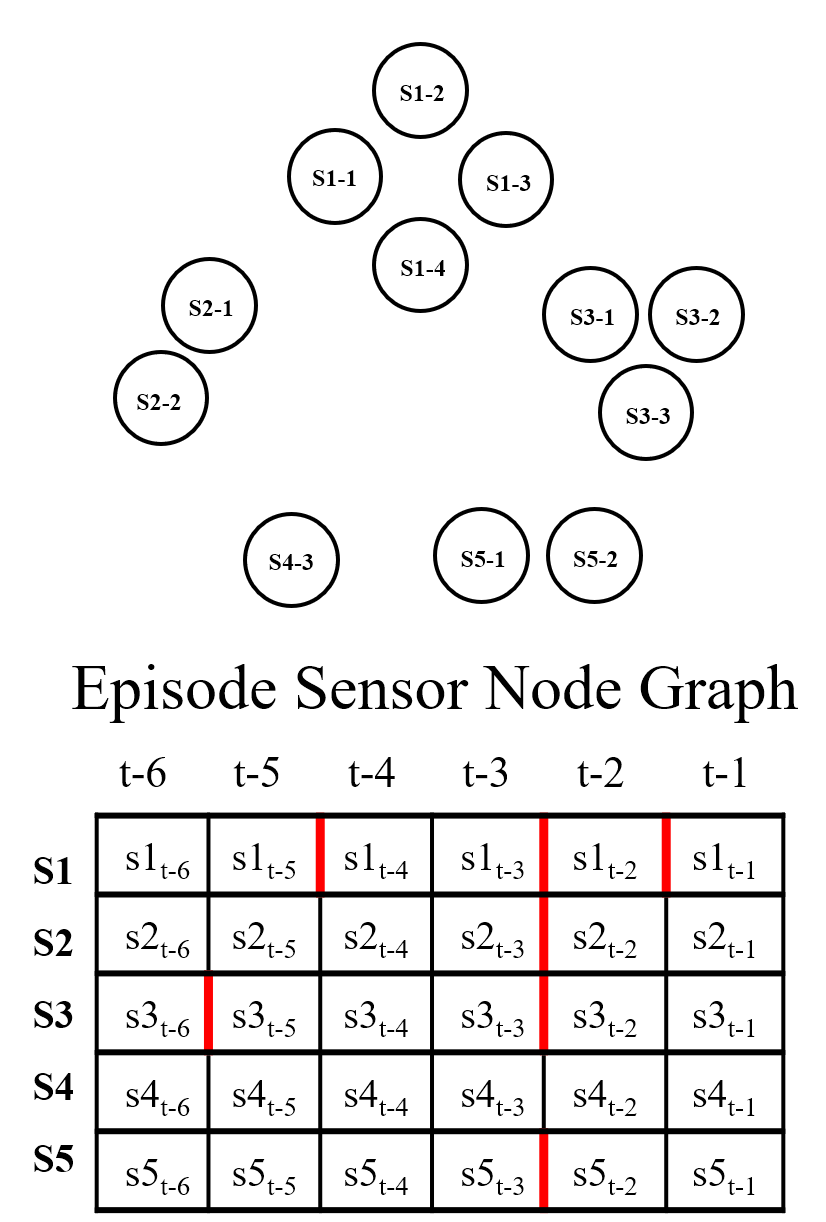
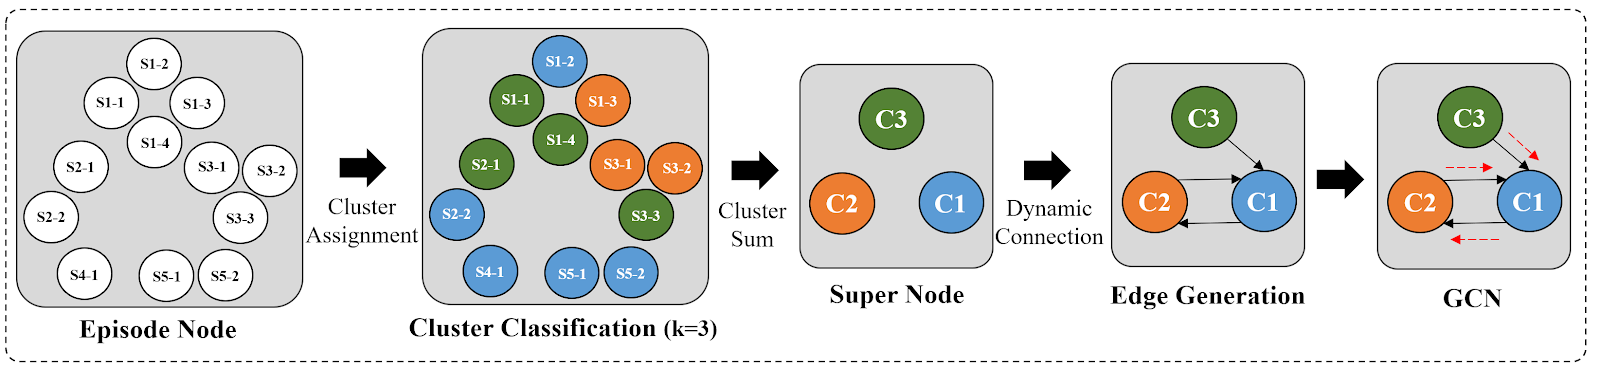
Segment into episodes and assign cluster indices
5
Build an episode-level node graph
6
Apply cluster-level Graph Convolution
7
Form the final Episode-Cluster GCN representation
4
Datasets
- Experiments are conducted on widely used benchmark datasets for multivariate time-series forecasting
- To verify the robustness of episode-boundary detection on periodic patterns, we select two strongly periodic datasets: ETTm1 and Weather
| ETTm1 | Weather | |
|---|---|---|
| Desc. | Electricity Transformer Temperature dataset | Meteorological time-series with strong seasonal variations (temperature, humidity, wind speed, pressure, etc.) |
| Sampling | 15 min | 10 min |
| # of features | 7 | 21 |
5
Experiments
Backbone Model
- Model: Informer
- Objective: Predict mean & standard deviation
- Loss: Gaussian Negative Log-Likelihood (NLL)
Forecasting Model
- Lookback window: 512 time steps
- Forecasting horizon: 92 time steps
- Evaluation metric: MSE(Mean Squared Error)
Forecasting Results (MSE)
GTA
Episode-Cluster GCN (Our)
ETTm1
0.0106
0.0098
Weather
0.0084
0.0059
6
Conclusions
Contributions
- Our method captures natural pattern changes through episode boundary detection
- It enhances structural graph representations
- It achieves better forecasting accuracy and improves interpretability
Future Works
- We will evaluate the model with various lookback and horizon settings
- We will explore alternative backbone models